In this section, we highlight & compare the UK’s best mobile deals. You can find the cheapest network for your handset or the best value SIM only deal.
Here in the UK, there’s thousands of handsets available and more than a million mobile phone tariffs to choose from across the networks. Regardless of if you’re looking for a new smartphone or simply a brand new SIM card, this section of the website aims to help you find the best deal. Which tariff is most suitable for your needs? What’s the best value option for your usage? We’ll aim to answer these questions here.
Please select the type of tariff you’re currently interested in:
Have you ever wanted to be a more informed mobile phone user? In this section of our website, you can learn everything you need to know to become a mobile expert.
Mobile phones and mobile technology are evolving on a daily basis. With the fast-moving pace and regular changes in the industry, it’s sometimes difficult to keep up. Which mobile phone network offers the best service? Which tariff will best suit my needs? How can I choose between the latest handsets?
In this section of the website, we’ll go back-to-basics and try to answer these questions. We’ll show you how to compare mobile networks, tariffs and handsets. Find out how to compare mobile network coverage, discover how many gigabytes you need every month and whether 5G technology is worth having. You can also learn more about the important considerations when choosing a smartphone, how telephony works in the UK and about mobile broadband services.
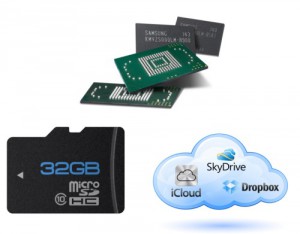
Smartphones have several types of storage: internal, micro SD and cloud storage. Here’s everything you need to know.
When choosing a smartphone, one of the most important considerations is the amount of storage. The amount of storage determines the amount of “stuff” you can have on your smartphone. Storage is required by everything from applications and games to photos and videos. Bearing this in mind, this guide shows you how to choose a smartphone with enough storage.
On today’s smartphones, there are three types of storage you’ll need to look at. The first is internal storage: this is embedded inside your phone and is used for the operating system and applications. Any space that’s left over can then be used for photos, music files and videos.
The second type of storage is Micro SD (external storage). With Micro SD, it’s easy to add additional storage to your device. Micro SD comes at a low price (around £10 for 16GB of additional storage) and can be used for photos, music files and videos.
The third type of storage is cloud storage. These are web-based storage services that allow you to store your files on remote servers. There are a range of cloud storage services from companies such as Apple, Microsoft, Dropbox and Google. One thing’s in common: you’ll need a working internet connection to access files from cloud storage.
In this article, we look at the three types of storage. We’ll look at the uses, benefits and disadvantages of each type of storage. Armed with this information, you should be able to make an informed decision on how much storage you really need. Finally, we’ll look across the market and compare today’s latest smartphones. We’ll look at how much storage they have and whether that’s suitable for daily use.
Will your next smartphone be too big? This interactive guide shows you a side-by-side comparison of mobile phone sizes.
Smartphones seem to be increasing in size all of the time. The latest generation of high-end smartphones have grown to encompass 5-inch displays at full HD resolution (this includes the Samsung Galaxy S4 and the Sony Xperia Z). Whilst bigger displays are great for browsing the web and using apps, it can sometimes be unwieldy to use a bigger phone for calling. An oversized phone can also be awkward to carry in a pocket.
With this interactive guide, we compare the size of different smartphones. Using the list below, select the devices that you’d like to compare the size of. We’ll show you all of the devices side-by-side and to scale. For an indication of the real-world size, select the “Show Full Size” option.
Ken’s Tech Tips is the no-nonsense guide to mobile technology and broadband providers in the UK.
My goal is for Ken’s Tech Tips to be the most helpful and informative website about mobile and broadband providers in the UK.
I want to empower every single person to make an informed choice about their next mobile network or broadband provider, without all of the complexity and jargon that you’ll often find in our industry.
This website was founded in 2005. Thanks to the ongoing support from readers in the UK and from around the world, we’ve now published more than 1,000 in-depth guides and received more than 30 million page views. We’ve also had more than 10,000 reader comments and contributions.
Thank you again for continuing to visit my website and for all of your ongoing support and contributions.
How Are Our Guides Produced?
All of the guides you’ll find on this website have been written by Ken. You can find out a bit more about who I am & my background.
Everything is written to the best of my knowledge, and based on my own research. However, I sometimes get things wrong (or things can often change quickly, given the industry we operate in). For this reason, if you do spot an error or omission, please do get in touch and let me know.
Please also double check and verify the information that’s provided directly with the individual provider before you sign up.
How Do We Generate Revenue?
I’m committed to keeping Ken’s Tech Tips a free website for everyone to use. At the same time, I put in thousands of hours of work maintaining the website each year (from researching individual providers, to producing new guides about the industry and keeping older ones up-to-date). It’s also the product of more than 15 years work.
As such, Ken’s Tech Tips needs to be able to generate revenue in order to fund and sustain it. Here are the key things to know about how we generate revenue on our website:
Our editorial independence is really important to us. We cover lots of different providers on our website, highlighting both the benefits and the shortfalls of their service. However, I’ll only recommend products and services that I think are worthy of my recommendation. I don’t accept guest posts or content written by other people so you can rest assured that everything you read has been researched & written by us.
Once our content is completed, we use software to turn normal hyperlinks into affiliate hyperlinks. Affiliate hyperlinks work in the same way as normal hyperlinks, giving you the same (or better) pricing than going direct. The key difference is that affiliate hyperlinks will allow the retailer to track the sale back to our website.
We also use comparison engine technology to show you deals relevant to the guide. For instance, if you’re reading an article about 5G mobile technology, we might embed a comparison table showing you the latest 5G SIM card deals. These comparison tables will normally use affiliate hyperlinks.
When you purchase through an affiliate hyperlink, we might receive a commission from the retailer. To give you complete transparency over which hyperlinks are affiliated, we’ll mark all affiliate hyperlinks with an asterisk at the end. It’s the same approach you’ll see on other websites such as MoneySavingExpert (of which I’m a huge fan!).
We won’t ever sell your data. For more information about the data we collect and how we use it, see our privacy policy.
Contact Me
It’s always great to hear from readers of the website! Find out how to get in touch.
Looking forward to 2012, what’s going to be new for the online world? How are the patterns of internet usage changing and what are the key challenges facing the internet?
The team from Plusnet: Bob Pullen, Ben Trimble and Plusnet super-user Barry Zubel.
Last week, I took part in a discussion held by Plusnet about the future of internet and the trends that we’ll see online in 2012. Our discussion covered a whole range of topics including the marketing of download speeds and download limits, traffic management and net neutrality and how new internet-enabled devices such as smartphones, tablets, televisions and games consoles will affect the way we interact with the internet.
In this article, I’d like to look back on the internet in 2011 and look forward to see how things might change in 2012. For me, 2012 will be an important year for the internet – particularly as the internet is moving beyond computers and onto a whole range of different form factors from a small-screen experience on a mobile phone to a large-screen experience on TV. Furthermore, talk of download limits and download speeds still confuses consumers. These are issues which must be tackled in 2012.
Ken’s Tech Tips has been tracking consumer choices in the UK mobile operator market for over a year. In this article, we reveal how the iPhone 4S has shaken up the UK mobile operator market.
At Ken’s Tech Tips, we spend a lot of time trying to understand how consumers interact with their phones and the thought processes they go through when choosing their new phone or mobile phone network. As part of that work, we’ve been carrying out research into the network choices and network switching intentions of UK mobile consumers over the past 13 months. We’ve been carrying out a poll of switching intentions and over 63,000 consumers have participated in our study over those 13 months. We now present the results of the study to date and how the release of the Apple iPhone 4S has affected the UK mobile operator market.
If you’re looking for an “ultraportable” computing device which you can take anywhere, you’ve got two choices: a tablet or a netbook.
Over the past few years, we’ve seen people demanding more from technology and the ability to access technology in more and more places.
Huge growth has recently been seen in the ultraportable computing sector. Ultraportable devices aim to offer both portability and computing power. In terms of both size and speed, they sit somewhere in between the smartphone you take everywhere and the laptop you leave on your desk. Ultraportables aim to offer the best of both worlds.
If you’re looking for an ultraportable computing device, you’ve got a choice between a tablet or a netbook. In this guide, we look at the history and design of both the tablet and netbook form factors. We also explore how the design heritages of both classes of device affect them practically and find out the pros and cons of each type of device.
We find out how e-ink screens (used by the Kindle) compare with LCD screens (used by iPad and most smartphones).
The Amazon Kindle e-book reader differs from most tablet devices in that it uses an e-ink screen as opposed to a colour LCD screen. Fundamentally, e-ink is a very different technology from LCD. In this article, we look at how e-ink and LCD display technologies work and compare the two technologies.
How do electronic ink (e-ink) displays work?
E-ink (electronic ink) displays produce images and reflect light in the same way normal paper does.
Paper reflects light from the Sun (and from artificial light sources such as light bulbs). Because paper reflects light of all wavelengths, it normally appears white (see left diagram below). In order to form an image on paper, we need to add a layer of ink in the relevant places. This layer of ink is non-reflective (this region appears black as black is the absence of light; see right diagram below). By selectively adding ink to a piece of paper, we can form the desired image.
Mobile phones with 3D displays finally reach the UK this month. In this article, we find out how they work and whether handsets such as the LG Optimus 3D and HTC Evo 3D will really be flying off the shelf.
The UK’s first 3D mobile phones begin to hit the shelves this month. 3D phones such as the LG Optimus 3D and HTC EVO 3D promise to allow you to watch 3D videos on your handset, to play 3D games and to record videos in 3D. But does 3D really add an extra dimension to the mobile experience? Will they revolutionise the mobile industry or will it be another short-term fad? In this article, we find out how 3D mobile phones work and discuss the outlook for them.
How does the human eye perceive 3D?
Like many other animals, humans have two eyes so that we can see in 3D. As each of our eye are in slightly different places, each eye will observe objects from a slightly different angle. The brain will then piece together the information received from each eye to calculate the distance to the object (hence giving depth perception).
 When choosing a smartphone, one of the most important considerations is the amount of storage. The amount of storage determines the amount of “stuff” you can have on your smartphone. Storage is required by everything from applications and games to photos and videos. Bearing this in mind, this guide shows you how to choose a smartphone with enough storage.
 Smartphones seem to be increasing in size all of the time. The latest generation of high-end smartphones have grown to encompass 5-inch displays at full HD resolution (this includes the Samsung Galaxy S4 and the Sony Xperia Z). Whilst bigger displays are great for browsing the web and using apps, it can sometimes be unwieldy to use a bigger phone for calling. An oversized phone can also be awkward to carry in a pocket.
 All of the guides you’ll find on this website have been written by Ken. You can find out a bit more about
  I’m committed to keeping Ken’s Tech Tips a free website for everyone to use. At the same time, I put in thousands of hours of work maintaining the website each year (from researching individual providers, to producing new guides about the industry and keeping older ones up-to-date). It’s also the product of more than 15 years work.
 The
The  The UK’s first 3D mobile phones begin to hit the shelves this month. 3D phones such as the