Ken’s Tech Tips has been tracking consumer choices in the UK mobile operator market for over a year. In this article, we reveal how the iPhone 4S has shaken up the UK mobile operator market.
At Ken’s Tech Tips, we spend a lot of time trying to understand how consumers interact with their phones and the thought processes they go through when choosing their new phone or mobile phone network. As part of that work, we’ve been carrying out research into the network choices and network switching intentions of UK mobile consumers over the past 13 months. We’ve been carrying out a poll of switching intentions and over 63,000 consumers have participated in our study over those 13 months. We now present the results of the study to date and how the release of the Apple iPhone 4S has affected the UK mobile operator market.
Contents
Ken’s Tech Tips Worm
![]() We first introduced the Ken’s Tech Tips Worm in July. It’s based on a similar design principle to the Worm sentiment tracker on television political debates. The “Ken’s Tech Tips Worm” is a month-by-month measurement of the aggregate consumer sentiment towards each mobile phone network.
We first introduced the Ken’s Tech Tips Worm in July. It’s based on a similar design principle to the Worm sentiment tracker on television political debates. The “Ken’s Tech Tips Worm” is a month-by-month measurement of the aggregate consumer sentiment towards each mobile phone network.
We believe that consumers vote with their feet and gravitate towards the mobile networks they like the most – whether that’s because that network offers the lowest prices, the best coverage in their area or simply has the best marketing strategy. By collating thousands of responses about how British consumers are switching between mobile networks (i.e. which network they are joining & which network they are leaving), we determine the net movement of customers between different mobile networks and hence each network’s overall performance or popularity.
For each month, we look at the ratio of the number of consumers joining a network to customers leaving that network. This calculation gives us the “Ken’s Tech Tips Index” – a numerical score representing how well each network is doing. The results for the past 13 months are shown below:
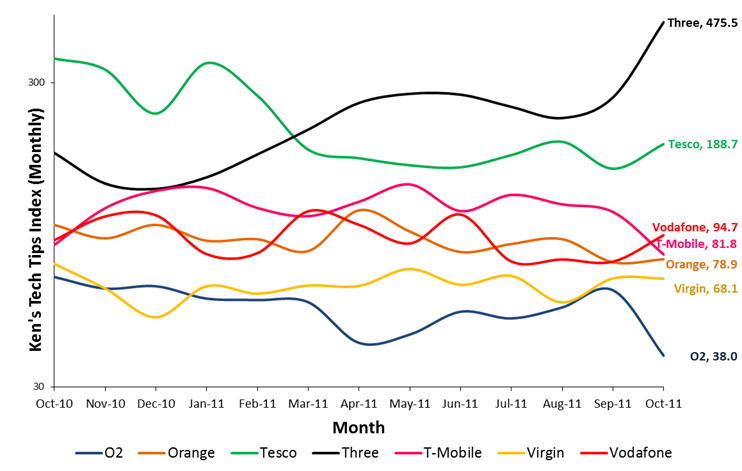
Fig. 1. The Ken’s Tech Tips Worm (October 2010 to October 2011). A higher score is better. The most recent numerical score (for October 2011) is shown on the right of the graph. The numerical score represents the “number of consumers joining a given network for every 100 consumers who leave the network”. A higher score is better. A score of 100 is neutral and represents no net change in customer number. A score below 100 represents a net loss of customers. Note the use of a logarithmic scale on the y-axis as scores range over an order of magnitude.
Trends in the Ken’s Tech Tips Worm
We previously carried out an in-depth discussion of the results up to June 2011 where we discuss the main trends up to that point. In the months since June, the most significant change comes in October 2011 where we see a huge boost in Three’s popularity which further cements their position as the favourite network of consumers taking part in our study. Three’s score rises from 268.7 in September to 475.5 in October (in other words 475.5 customers joined Three in October for every 100 customers who left in October). The fortunes of O2 are reversed: their score drops from 62.4 in September to 38.0 in October – the lowest score they have ever achieved in the Ken’s Tech Tips Index.
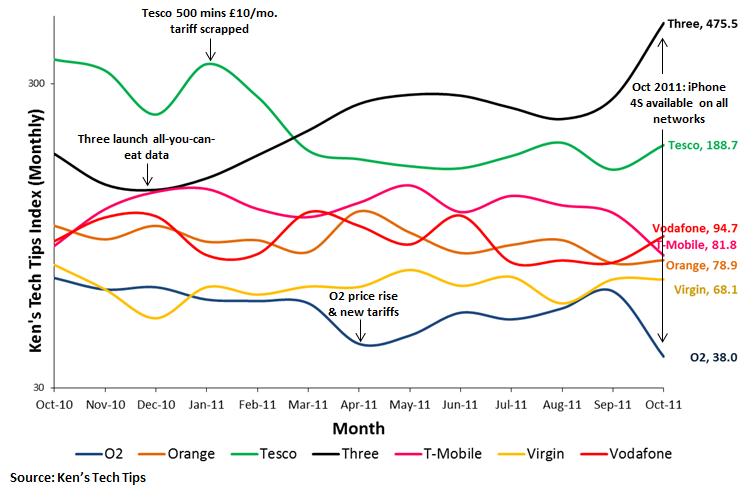
Fig. 2. The Ken’s Tech Tips Worm (October 2010 to October 2011). A higher score is better.
October 2011: The effect of the iPhone 4S
 From the “Ken’s Tech Tips Worm”, it is clear that October 2011 is a significant month which shook up the UK mobile operator market. Three benefited from a huge jump in popularity whereas O2 dropped in popularity significantly. To understand the large disparity in how Three and O2 fare in our October index, we have to look more closely at that period.
The following graph shows a week-by-week breakdown of which networks consumers chose to join in October 2011. We have shown the data for August 2011 and September 2011 – these months provide a baseline of the scores as they were before the release of the iPhone 4S.
Before the release of the iPhone 4S, approximately 25% of consumers opted to join Three. After the release of the iPhone 4S, this rose to around 35%. We believe this is because consumers are drawn to Three for the iPhone 4S because of their competitively-priced iPhone 4S tariffs and the lure of all-you-can-eat data and free mobile broadband. Support for high-speed HSPA+ connectivity on Three is also likely to have drawn some consumers to Three but we suspect this is only a small factor due to the lack of mainstream awareness of HSPA+.
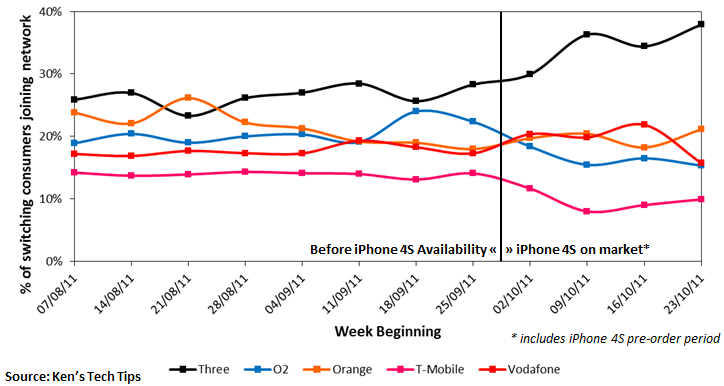
Fig. 3. Weekly breakdown of responses on which network consumers said they were joining. Pre-orders for the iPhone 4S began on October 7th with general availability beginning on the October 14th. If the iPhone 4S has caused a change in which network consumers chose to join, we would expect to see a slight change in week beginning 2nd October (two days of the pre-order period fall within this week) with a much larger change being seen in the week beginning 9th October. We believe that this pattern is indeed observed for Three and adds weight to our argument that the iPhone 4S is responsible for the large change in their October “Ken’s Tech Tips Index” score.
If consumers are choosing to join a new mobile network, the other part of the story is which networks they’re leaving. Due to the high mobile technology penetration rate in the UK (130 mobile phones for every 100 people), the vast majority of those consumers would have had to come from somewhere else.
The following graph shows a week-by-week breakdown of which networks customers said they were leaving.
There is a clear jump in the number of customers leaving O2 from around 35% to 45% just after the iPhone 4S hits the market. This indicates that O2 have been losing customers at a faster rate since the iPhone 4S came to market whereas other networks haven’t been affected so much. We suggest this originates from the fact that most iPhone contracts are 24 months in length and hence any iPhone customers upgrading to the iPhone 4S in October 2011 must have started their contract before October 2009. In October 2009, O2 were the only network offering the iPhone in the UK. Orange launched the iPhone in November 2009, Vodafone in January 2010, Three in June 2010 with T-Mobile being the last network to offer the iPhone in July 2010. It’s clear that with increased competition for iPhone tariffs, O2 are having a tough job holding on to those customers.
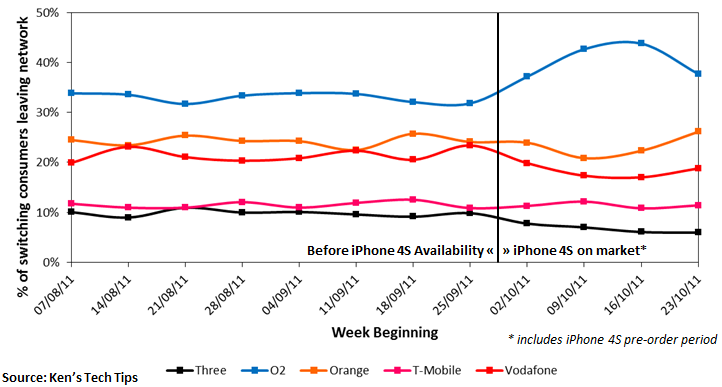
Fig. 4. Weekly breakdown of responses on which network consumers said they were leaving. Pre-orders for the iPhone 4S began on October 7th with general availability beginning on the October 14th. If the iPhone 4S has led a lot of consumers to switch network when they upgrade, we would expect to see a slight change in week beginning 2nd October (two days of the pre-order period fall within this week) with a much larger change being seen in the week beginning 9th October. This is indeed observed for O2 adding weight to our argument that the availability of the iPhone 4S has caused them to lose customers and is responsible for the large drop in their October “Ken’s Tech Tips Index” score.
Conclusions
Our week-by-week analysis of which network people are joining and leaving has shown that Three have benefited from the launch of the iPhone 4S whilst O2 have suffered. We believe that many iPhone owners who are currently on O2 have decided to switch to Three due to their competitively-priced iPhone 4S tariffs and offer of all-you-can-eat data. It is worth noting that O2 scrapped “unlimited data” for new/upgrading customers on their network in June 2010 – the only way that an upgrading O2 iPhone owner can keep unlimited data would be to switch to Three’s The One Plan which offers all-you-can-eat data. Alongside Three’s low prices, we believe that all-you-can-eat data is main driver of customers migrating from O2 to Three in October 2011.
Of the consumers who decided to leave O2 in October 2011, their destination network is as follows:
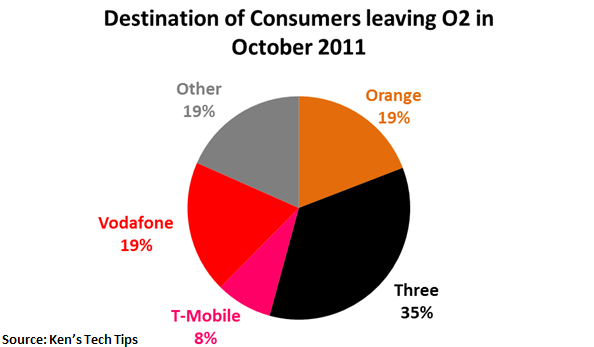
Fig. 5. Destination network of consumers who are leaving O2. ‘Other’ consists of the MVNO networks such as Giffgaff, Tesco Mobile and Virgin Mobile.
Putting it together, we conclude:
- The launch of the Apple iPhone 4S in October 2011 has had a significant impact on UK mobile operators. The biggest winner is Three whilst the biggest loser is O2.
- There was a significant increase in the number of consumers who wanted to join Three. We believe this is due to Three’s competitively-priced iPhone 4S offering, the inclusion of all-you-can-eat data (particularly attractive to upgrading O2 customers). Three’s HSPA+ network and the iPhone 4S’ support for HSPA+ may also be a pull factor but the lack of consumer awareness about HSPA+ makes this unlikely.
- O2 have failed to hold on to many of their existing iPhone customers. 24 months ago, the iPhone was only available on O2. As many of these customers look to upgrade their phone, they will for the first time have the choice of five different networks. With the increased competition for iPhone customers, 35% of upgrading customers are opting to switch to Three instead. Confusion about O2’s new data plans and the desire for unlimited data are likely to be a key factors pushing customers from O2 to Three.
Methodology
 When consumers switch mobile phone network, they’ll often want to transfer their phone number. This is achieved using a “PAC Code”. We provide a PAC Code Finder application on our website which guides people through the entire process of transferring their phone number. The “PAC Code Finder” application has been used by 63,000 consumers since its launch in October 2010.
As part of the “PAC Code Finder” application, we ask consumers to state which network they are leaving and which network they are joining. By analysing the responses of consumers to these two questions and how those responses have changed over time, we are able to determine consumer “sentiment” towards each network. With a more in-depth analysis, we are able to see how events such as the launch of the iPhone 4S have affected different mobile operators.
More Information
If you have any questions about the study or would like to find out more, please contact Ken Lo.
This report can also be downloaded in PDF format.
Appendix: Additional Figures
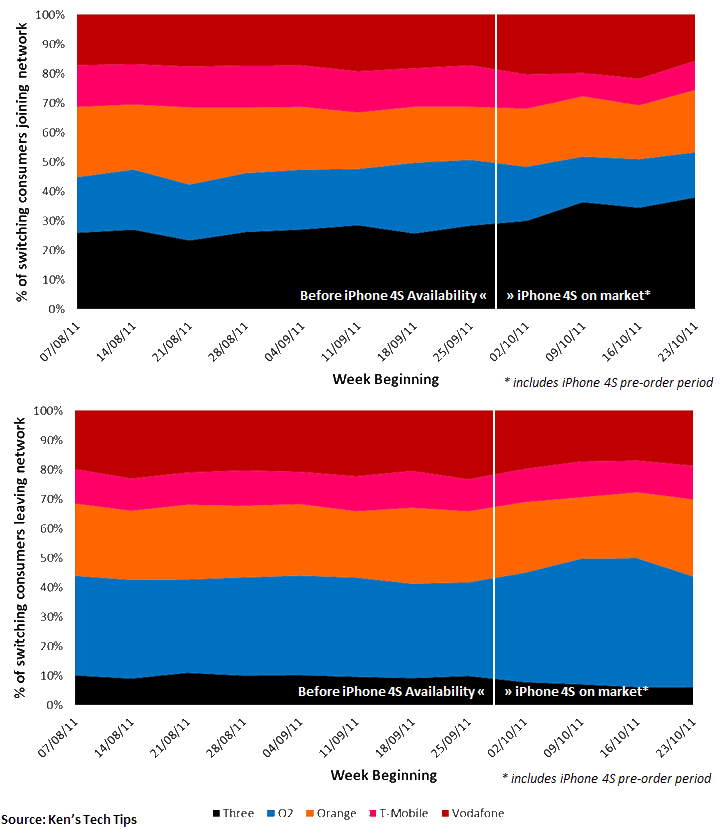
Fig. 6. Weekly breakdown of responses on which network consumers said they were joining and leaving. This figure shows the same information as shown in figures 3 and 4 but as a stacked area chart rather than a line chart. Please refer to captions for figures 3 and 4 for more information.
Monyanajoe said:
Fantastic great work finger right on the pulse yet again.