Ken’s Tech Tips has been tracking the popularity of the UK’s major mobile operators over the last 9 months. In this article, we reveal how they all fare.
![]() During the UK Election Debates of 2010, we were glued to our screens and the sentiment-tracking application known as “The Worm”. The Worm showed a real-time, second-by-second overview of the “sentiment” expressed by viewers to each politician speaking in the debate. As the party leaders made arguments which were popular with viewers, the worm moved up the screen. Meanwhile, unpopular statements which didn’t go well with the public (such as personal attacks) moved the worm down the screen.
During the UK Election Debates of 2010, we were glued to our screens and the sentiment-tracking application known as “The Worm”. The Worm showed a real-time, second-by-second overview of the “sentiment” expressed by viewers to each politician speaking in the debate. As the party leaders made arguments which were popular with viewers, the worm moved up the screen. Meanwhile, unpopular statements which didn’t go well with the public (such as personal attacks) moved the worm down the screen.
In this article, we unveil the Ken’s Tech Tips Worm – our version of “The Worm” but for mobile operators and their respective product offerings. By collating thousands of responses about how British consumers are switching between mobile networks (assuming they vote with their feet and gravitate towards the networks they like), we’re able to track the popularity of each mobile network over time and in response to different product offerings.
Over the previous 9 months, we’ve collected a total of 33,641 responses in our survey about network switching intentions (full methodology below). Splitting these responses up by month, we look at the ratio of the number of consumers joining/leaving a network in a given month. This calculation gives each network a numerical score. By looking at how the scores of networks compare and how they change over time, we’re able to see the response of consumers to new product offerings and services.
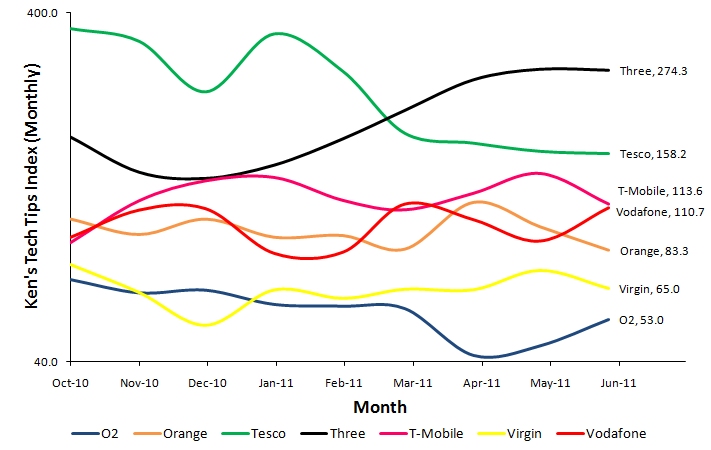
As of March 2011, Three has been the UK’s favourite mobile phone network according to our study.

The Ken’s Tech Tips Worm (October 2010 to June 2011). A higher score is better. The most recent numerical score (for June 2011) is shown on the right of the graph. The numerical score represents the “number of consumers joining a given network for every 100 consumers who leave the network”. A higher score is better. A score of 100 is neutral and represents no net change in customer number. A score below 100 represents a net loss of customers.
What tariff changes in the last 9 months could have caused The Worm to move?

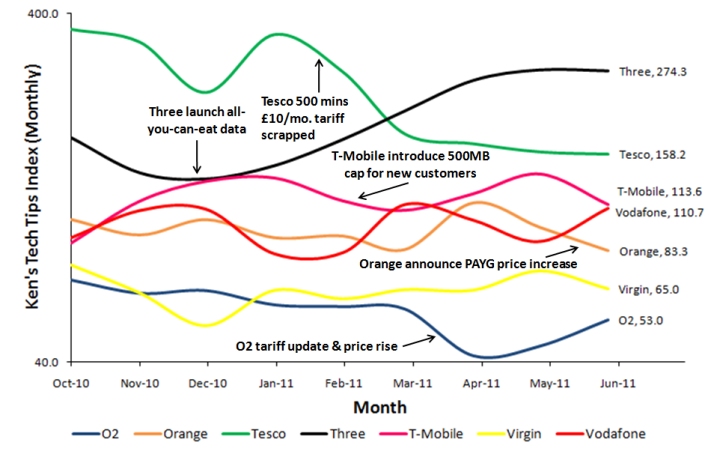
Annotated version of the Ken’s Tech Tips Worm (October 2010 to June 2011). A higher score is better.
- Launch of all-you-can-eat data on Three: A major trend we observe is the increase in popularity of Three since December 2010. This coincides with the addition of all-you-can-eat data to Three’s flagship “The One Plan”. Starting from £25/month, Three currently offers 2000 minutes, 5000 texts, all-you-can-eat data and free tethering on The One Plan. “All-you-can-eat data” seems to have been popular with consumers at a time where most networks have been cutting their download limits.
- Tesco Mobile saw some very high scores in late 2010/early 2011. They previously offered 500 minutes, unlimited texts and 500MB internet on a £10/month SIM-only contract – something which undercut the market hugely. This deal was removed in January 2011 with consumer sentiment falling in response.
- T-Mobile’s introduction of a 500MB download limit for new customers: T-Mobile chose to introduce a 500MB download limit for new customers from February 2011. We didn’t observe a significant response from consumers in The Worm: perhaps because the introduction of a 500MB download limit simply brought them in line with the rest of the market.
- O2’s tariff refresh and price rises: O2 updated their Pay Monthly line-up in April 2011. The revamp included price rises, the introduction of tiered data plans and the inclusion of tethering. We saw an adverse consumer reaction to the revamp, perhaps due to the price rises and the additional confusion caused by consumers having to understand which data plan is most suitable for them. O2’s score has recovered partially since April 2011 with many networks introducing price increases of their own.
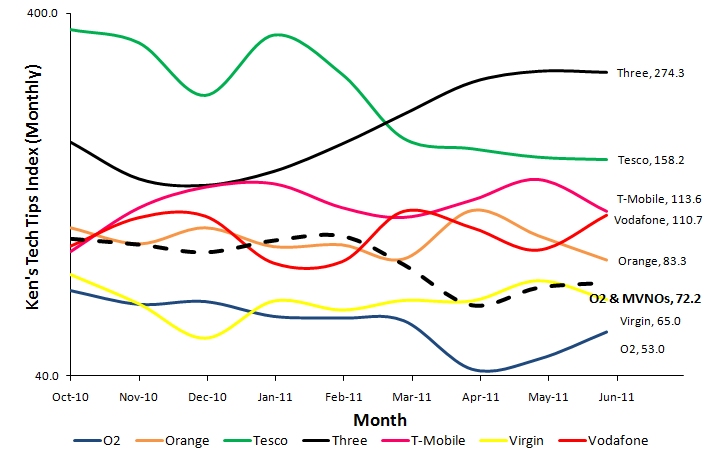
- O2’s low scores in our study can be partially attributed to their “multi-brand” MVNO strategy. O2 have openly admitted that they are focussing on the subset of “high-value” customers with their core “O2” brand. In an interview with Mobile Today, O2 said they “consciously decided not to chase volumes, as limited value was seen in the market”. Instead, O2 have targeted the lower-end of the market using the Tesco Mobile and Giffgaff brands. When we consider O2, Tesco and Giffgaff brands together (“O2 & MVNOs” in diagram below), O2’s score doesn’t look as bad as before.

How is data for the “Ken’s Tech Tips Worm” collected?
When consumers switch mobile phone network, they’ll often want to transfer their phone number. This is achieved using a “PAC Code”. We provide a PAC Code Finder application on our website which guides people through the entire process of transferring their phone number. By analysing how consumers are transferring their phone numbers between different mobile networks, we are able to determine the popularity of each network and the “consumer sentiment” towards that mobile operator.
The method behind the numerical calculations in this study is based on the methodology used to calculate the “Ken’s Tech Tips Index”. The key difference is that the numerical scores for The Worm are calculated on a monthly basis.
Further reading…
- In a two-part interview with the billmonitor website (see part 1 and part 2), I offered some further analysis behind some of the trends seen in the Ken’s Tech Tips Worm. I also give my views on how the mobile industry is affected by complexity and choice paralysis and how Three have benefited from tariff simplification.
- The results are based on the self-reported switching intention of consumers through our PAC Code Finder application.
- More information on the methodology used to calculate individual numerical scores can be found at our discussion of the Ken’s Tech Tips Index.
- Please contact Ken Lo if you have any further questions about this study.
gedicht said:
Wow very nice charts! 🙂